The History of Virtual Seismic Reality
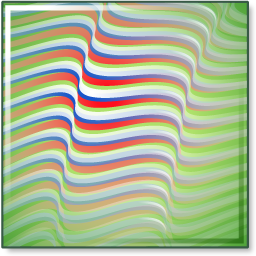
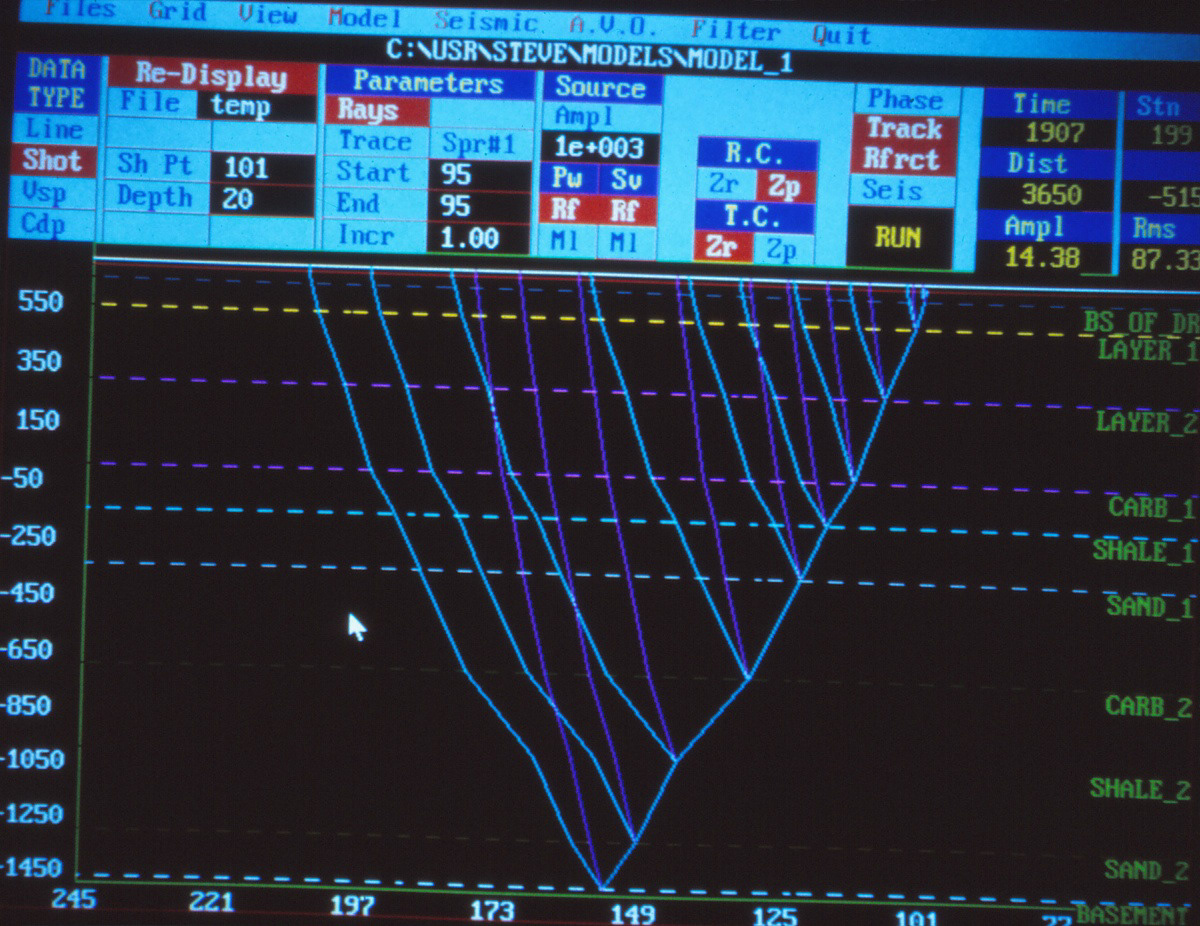
1979 Stacking Velocity Display
1979 VSR Began Here
Although VSR is a modern concept and relies on technologies not dreamed of in 1979, it really began with my initial interest in visualization, which itself began with this image.
I produced it in 1979, less than two years into my career with Gulf Canada.
It is a velocity analysis display.
The colored boxes represent stacking velocities obtained from Gulf's CCVA program.
The display was very popular within Gulf and it eventually made its way to Western Geophysical who patented it under the name Shadcon.
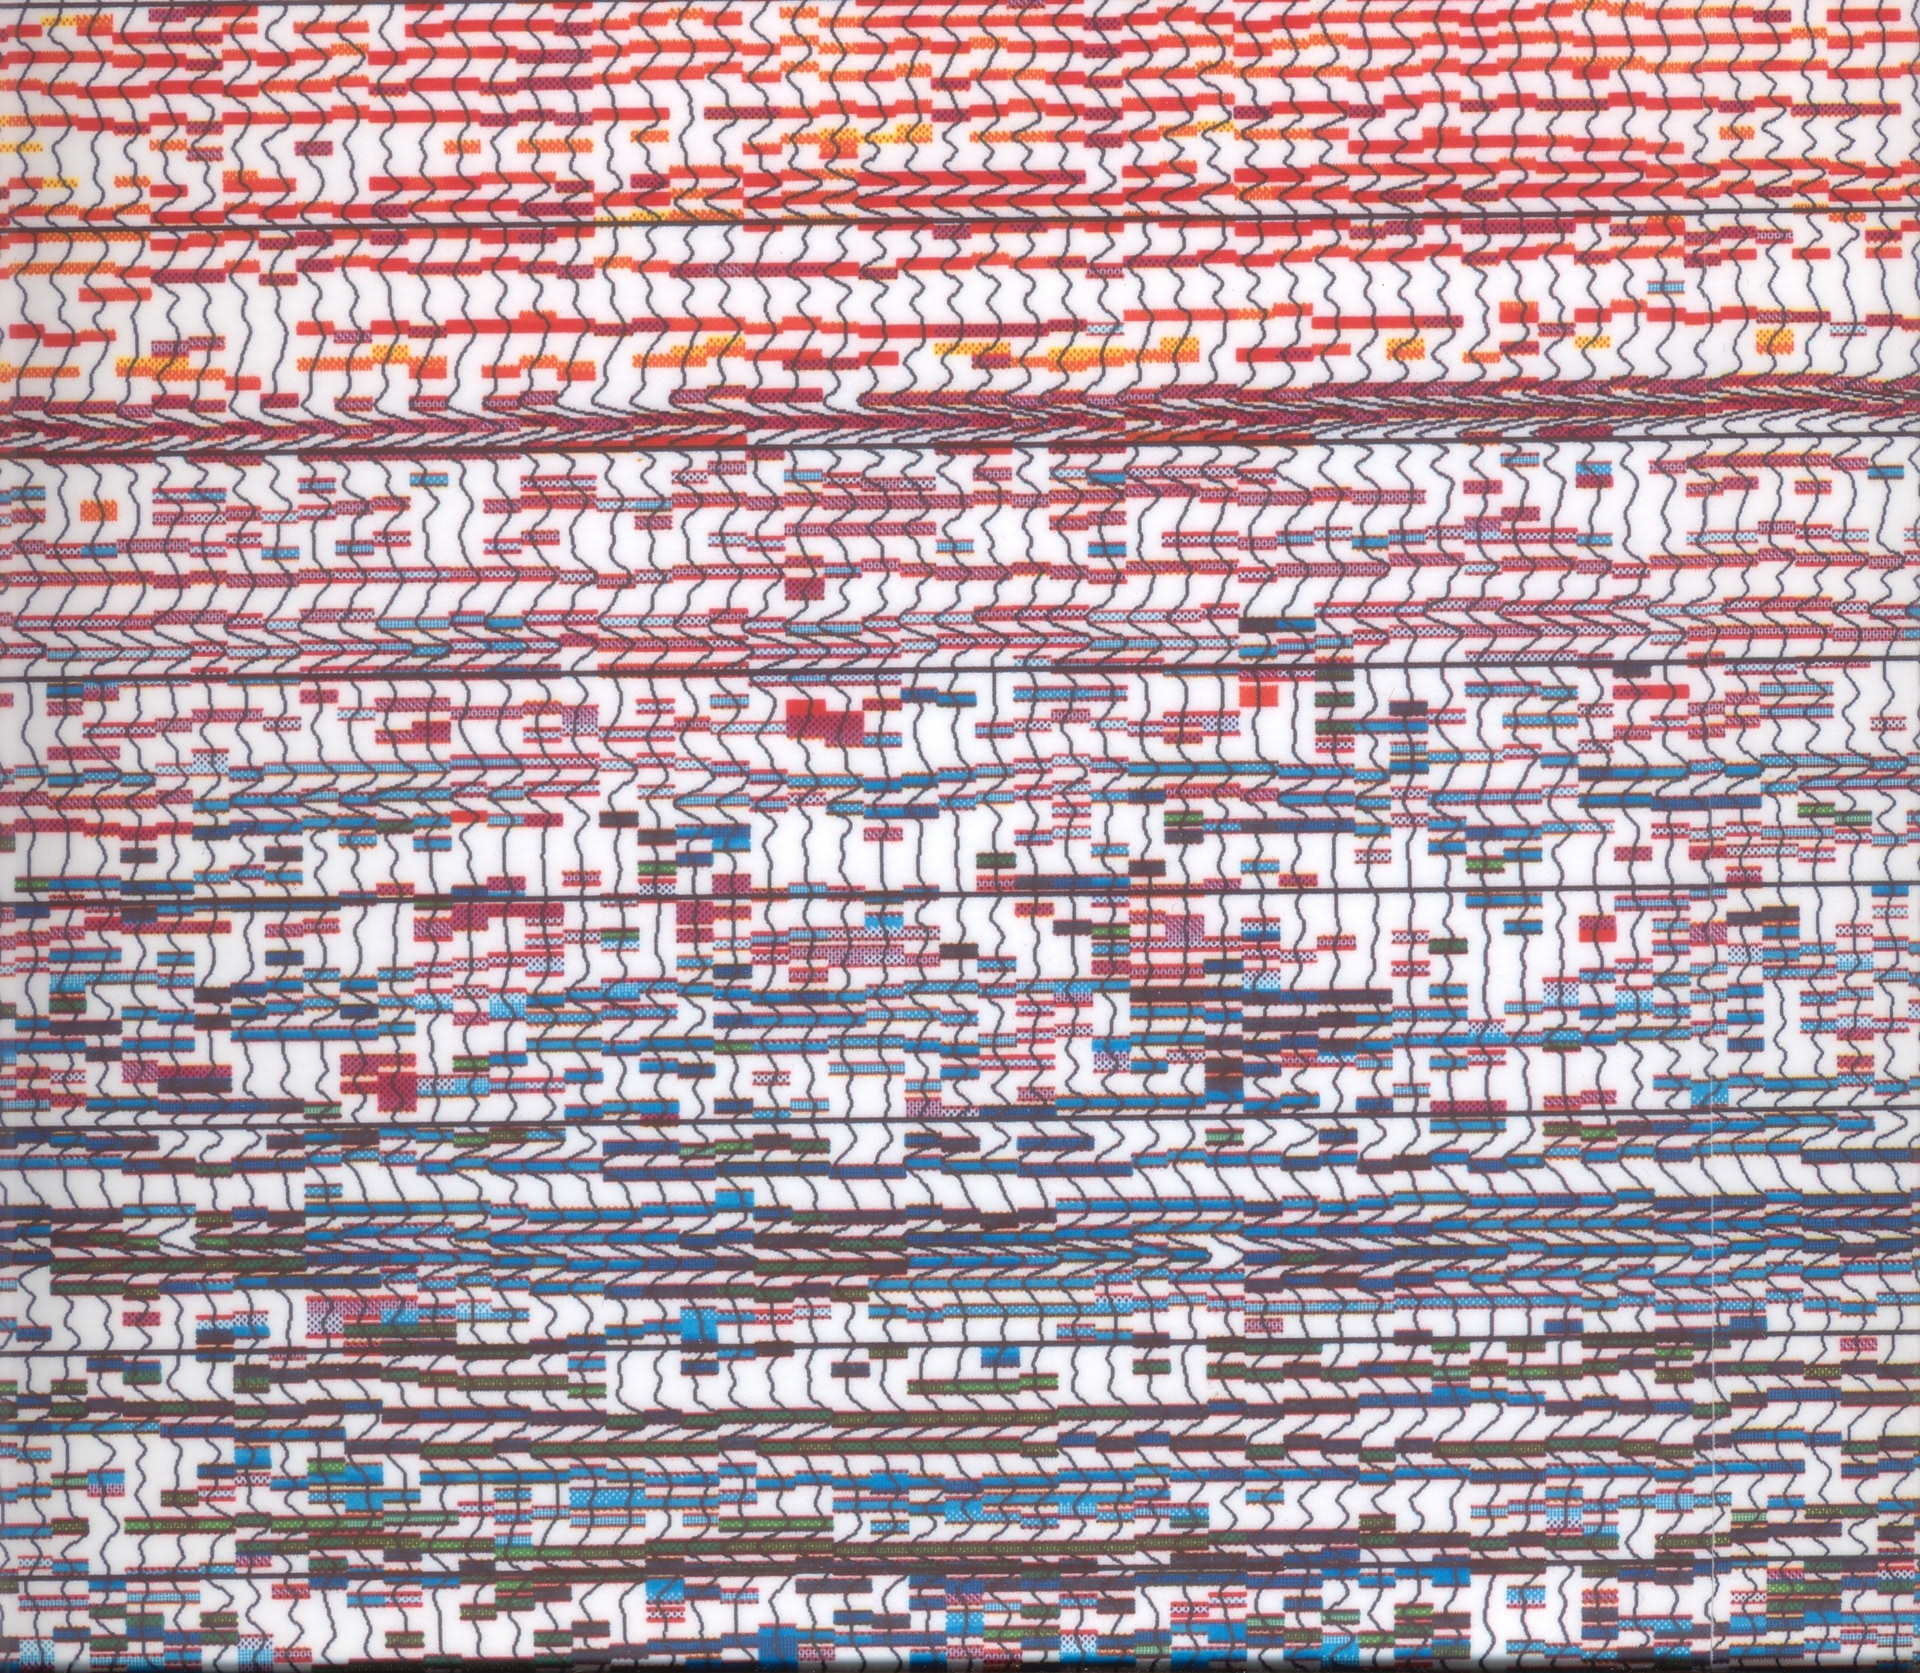
Mockup of an early Pixelated Variable Density Display
Building on my Success
I tried my hand at producing a colored seismic display.
It looked very much like this.
I used Blue - White - Red only because they were visually distinct.
I had great hopes for the display but as the saying goes: "all glory is fleeting"
The display was heavily criticized and no one would use it.
Humbled, I went on with more interesting projects.
1980's Refraction Modeling
Early 90's DOS Based Modeling
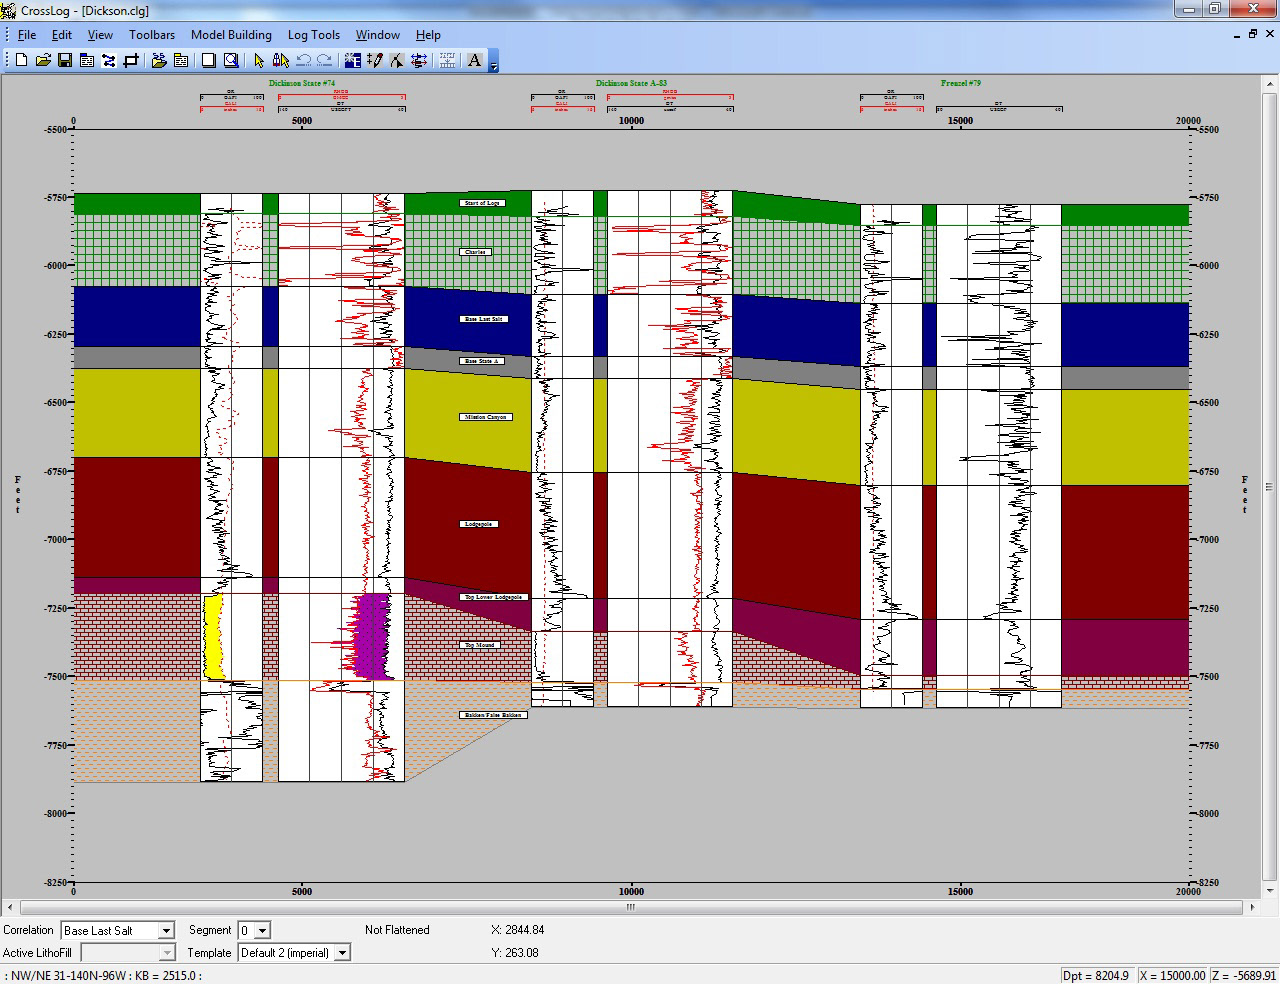
Late 90's Cross Section Software
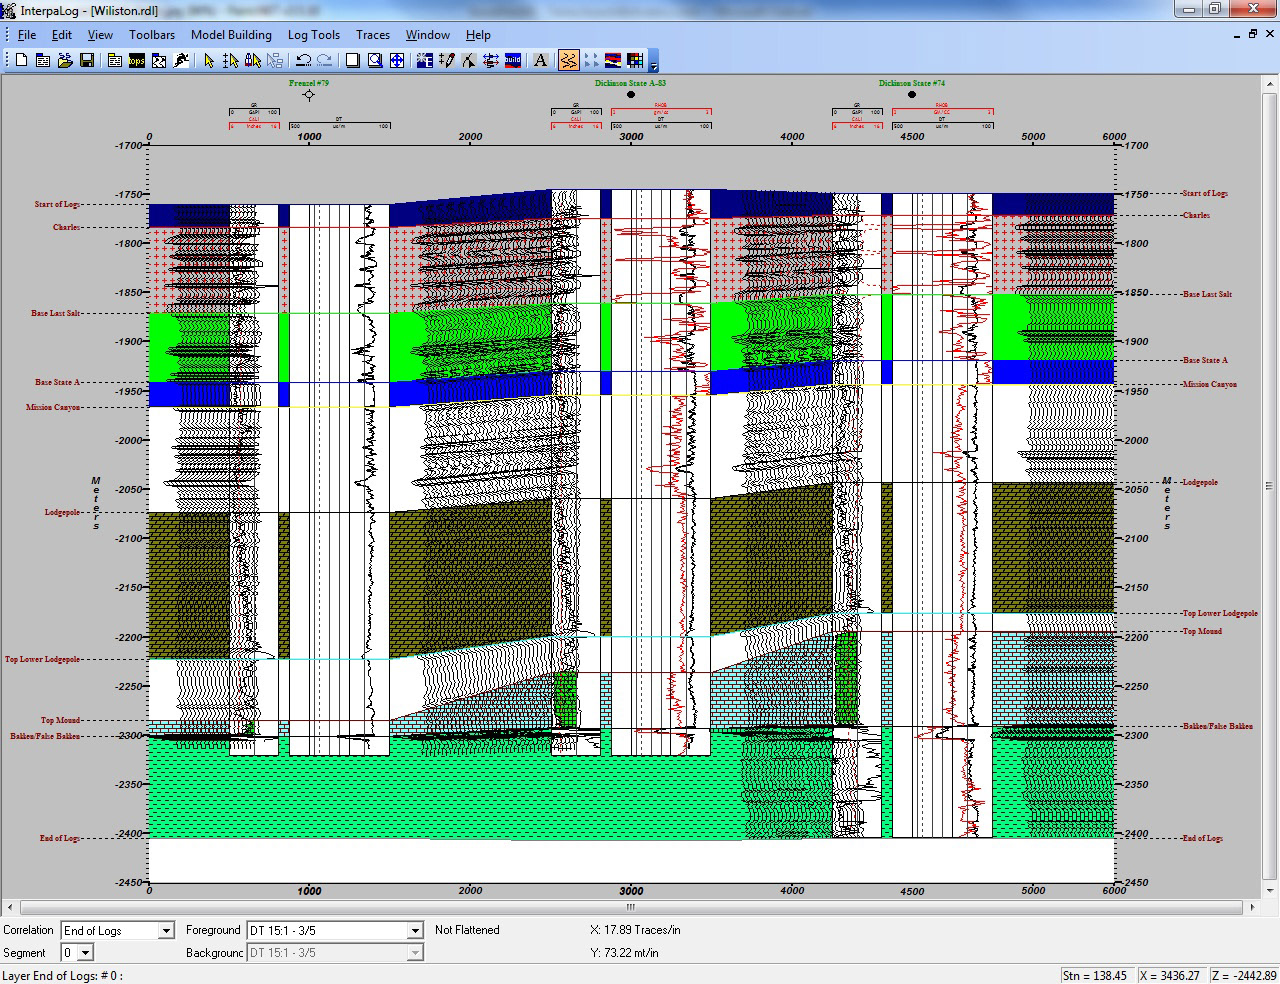
Late 90's Stratigraphic Modeling
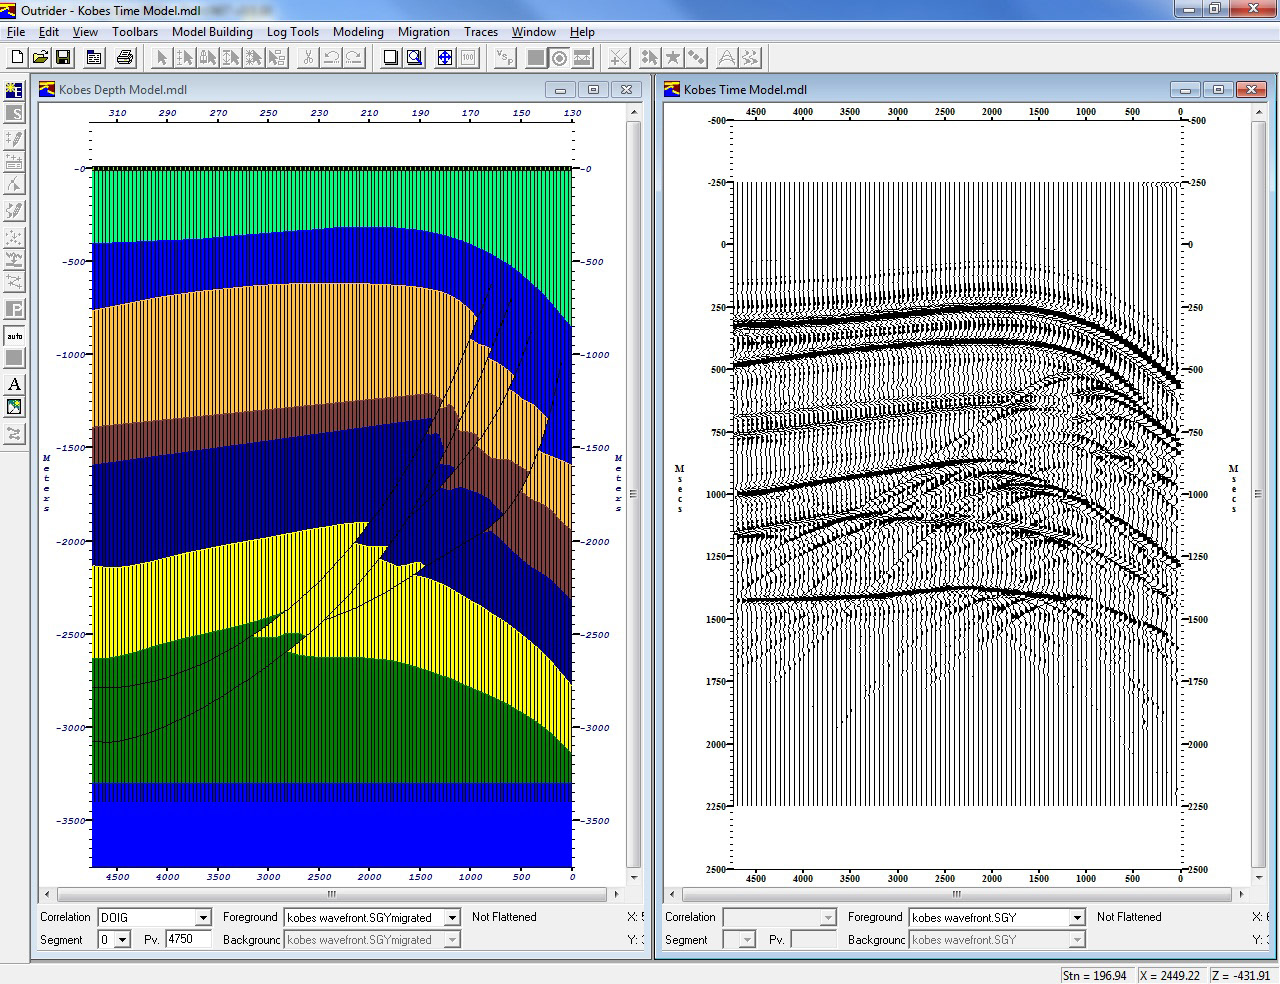
Late 90's Structural Modeling
Over the next 20 years
I developed the industries first modeling package (for refraction statics).
I managed seismic processing centers.
I developed software for structural and stratigraphic modeling.
I dabbled in depth migration.
In fact, I did everything except work on visualization.
Who would?
After all, the field was dead ended. What else could you do?
Virtual Seismic Reality took off with NVidia TNT2 Ultra
The Paradigm Shift at the end of the Millennium
In September 1999 I became aware of the paradigm shift taking place in computing.
Up to that point, computer development had been driven by industry.
But it was starting to be driven by gaming and the needs of Virtual Reality.
I began a test project to see if gpu's were fast enough to process seismic.
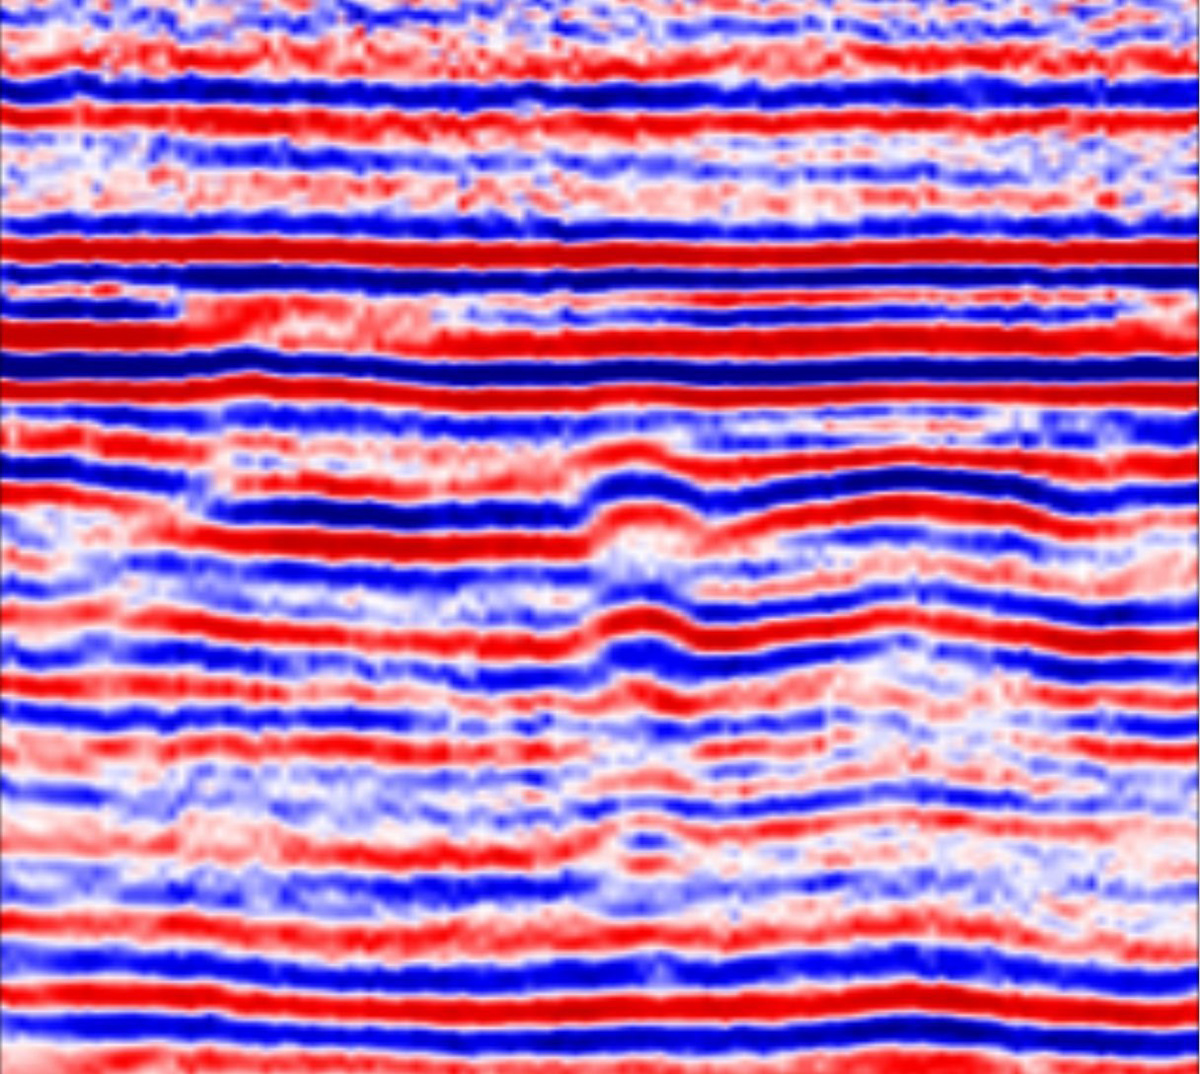
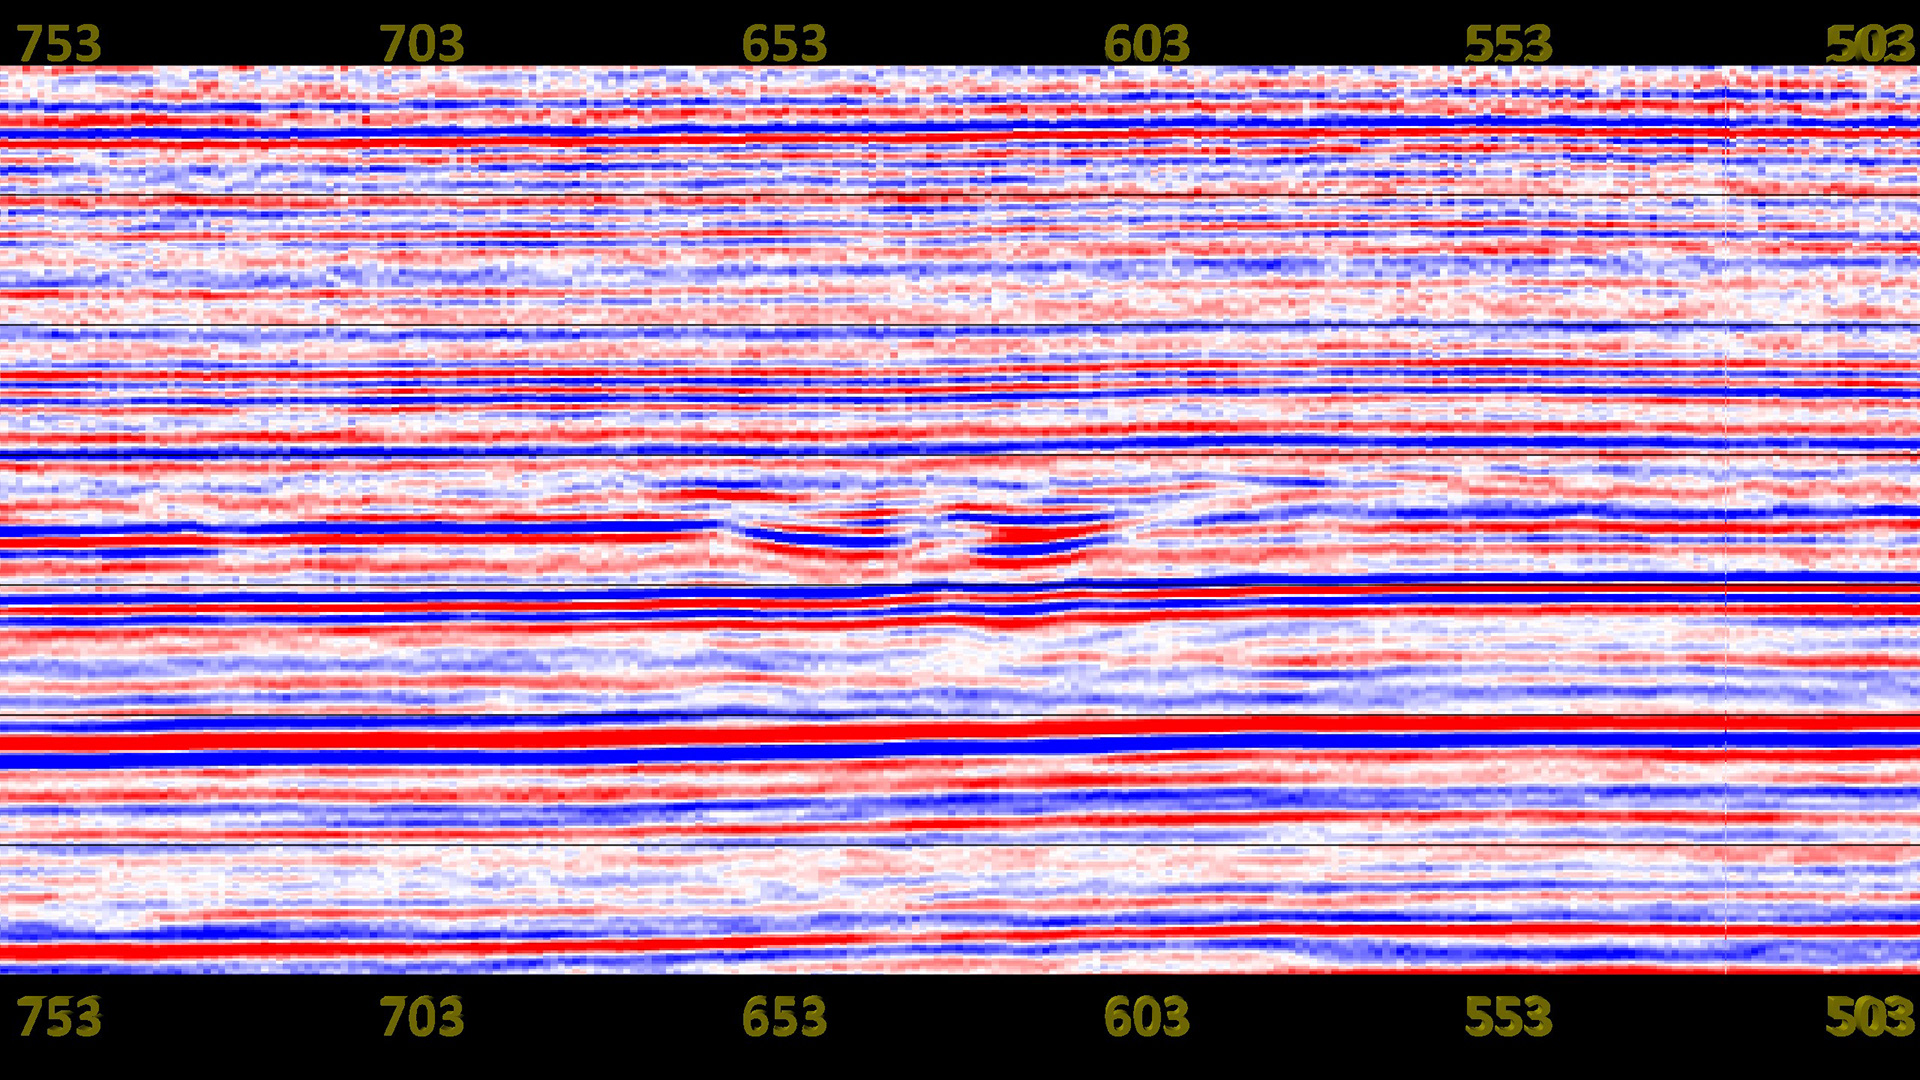
The first Seismic to be 3D Rendered
A Simple Test with unexpected Results
At the time, gpu's were not programmable so I could not test directly.
I decided to see if I could render this small line in 3D.
It takes a lot of arithmetic to render even a single triangle.
If the card could render it then it could process it.
I had no idea what it would look like in 3D.
And, like every other geophysicist on the planet, I didn't care.
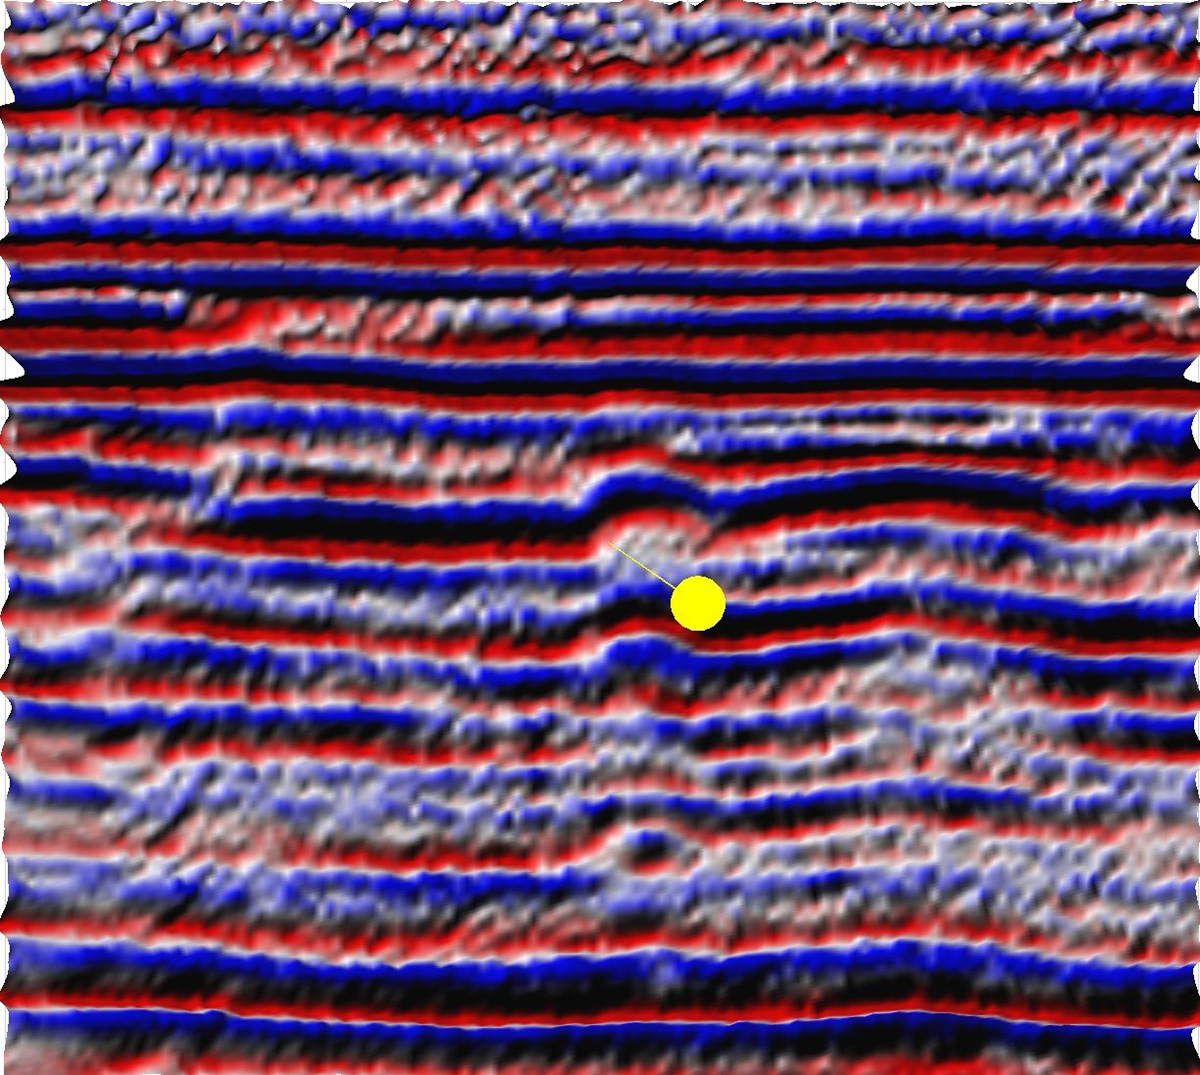
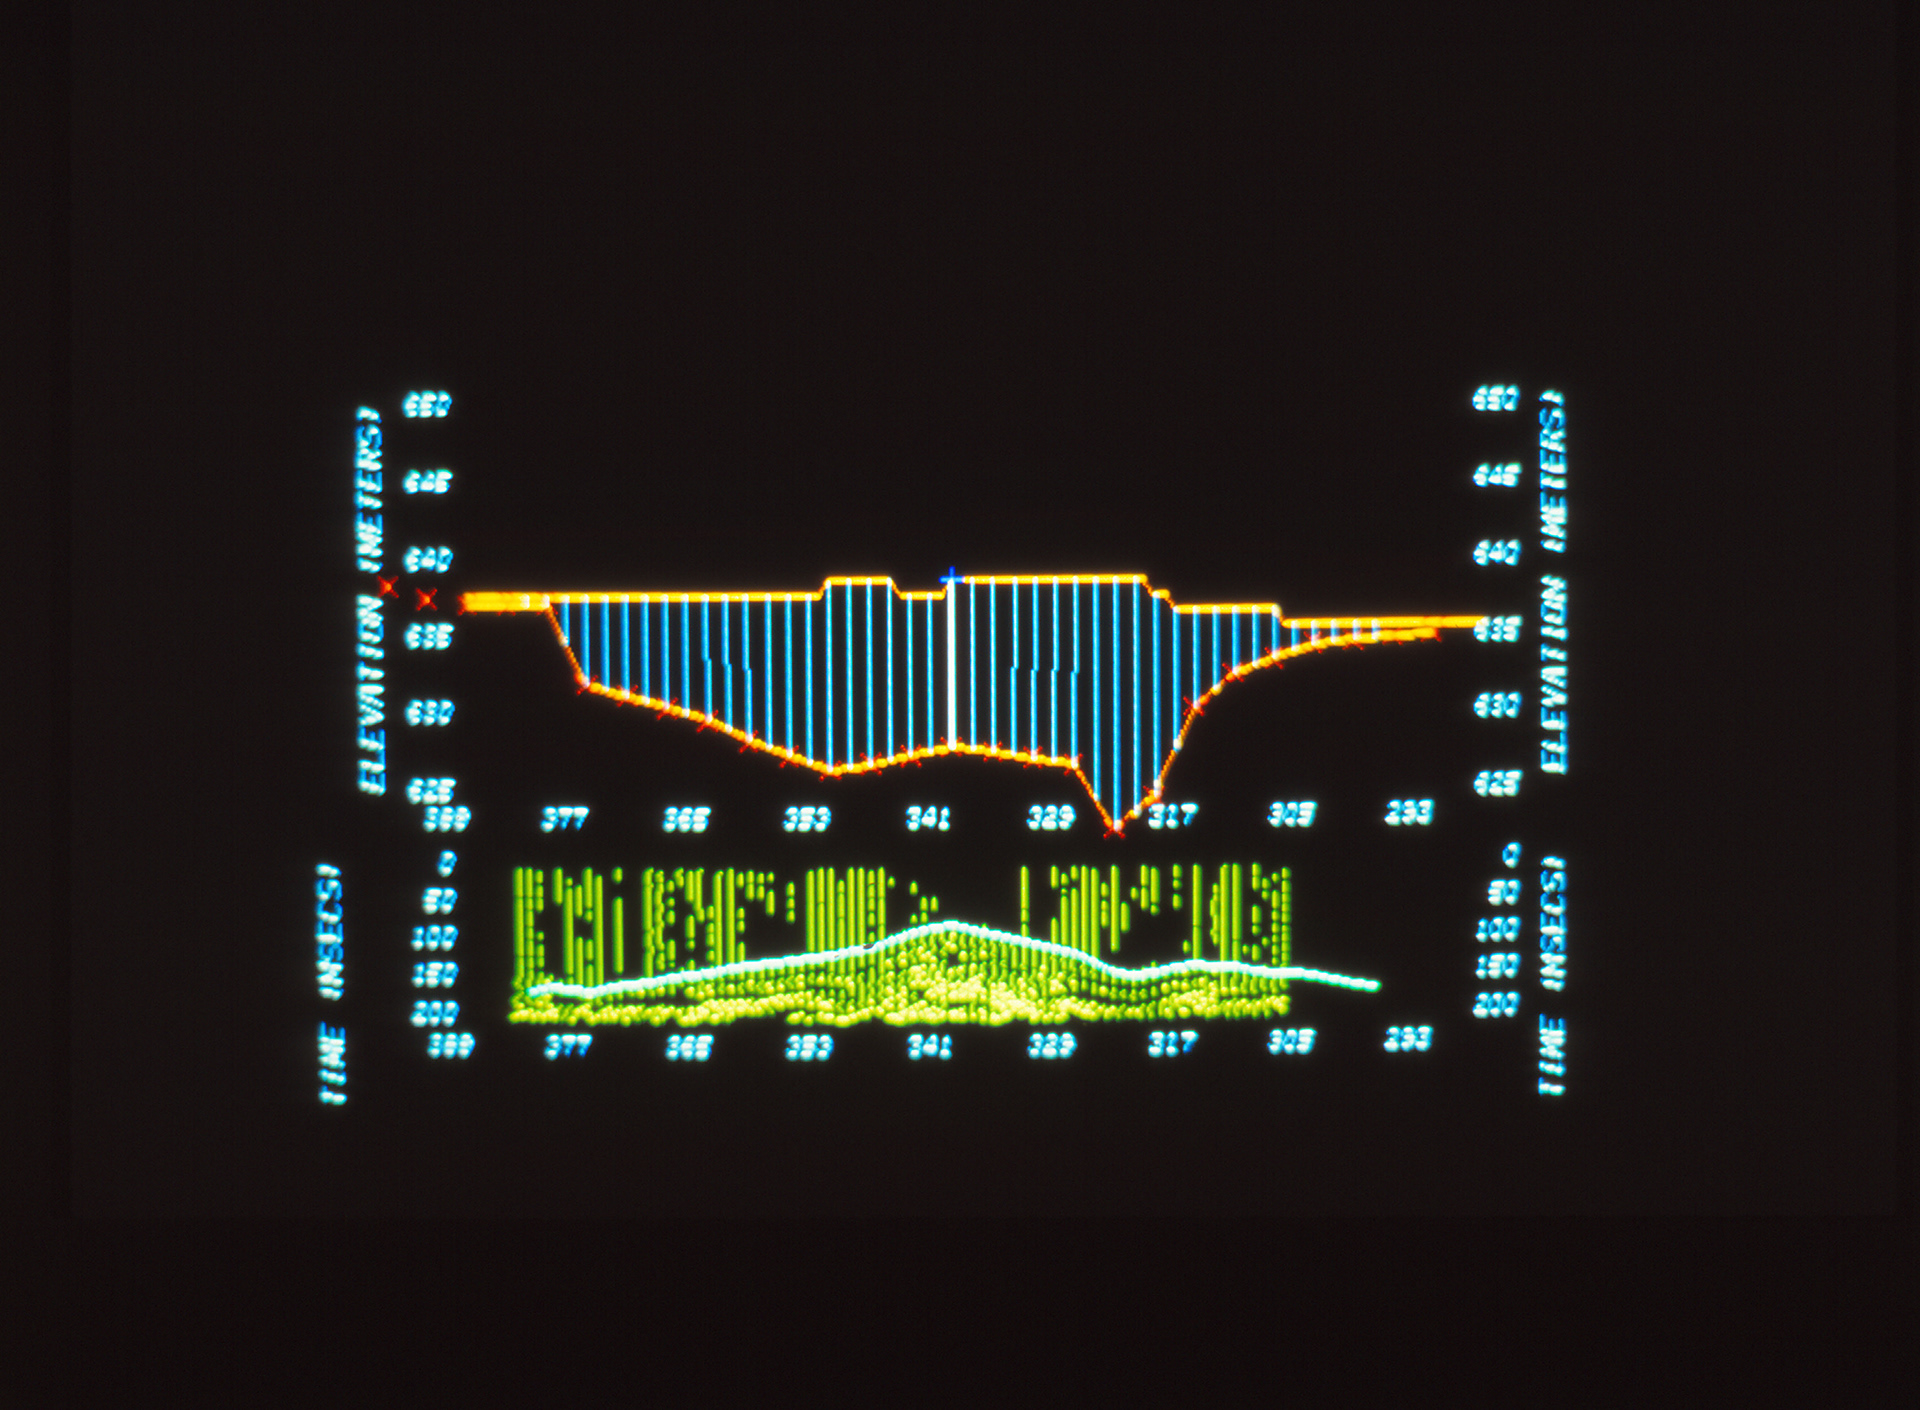
My first "Virtual Seismic Reality" Display
This is what it looked like
This is the first true Virtual Seismic Reality image.
It made me curious!
To this point I hadn't considered that there were details I was missing.
I assumed that I could see everything that was in the data.
But this single image proved that I wasn't.
I began to wonder, "what else am I missing".
It was that thought that launched VSR.
More than Meets the Eye: A Study in Seismic Visualization
More than Meets the Eye
My early work convinced me that visualization should be researched.
In 2003, I returned to University and began work on my PhD.
The result in 2008, was a thesis putting visualization onto a scientific footing.
I traced a photon from one end of the visual system to the other.
I learned how to create visual perception.
And I learned that it isn't what you can see that is important ...
It's what you can't see but should.
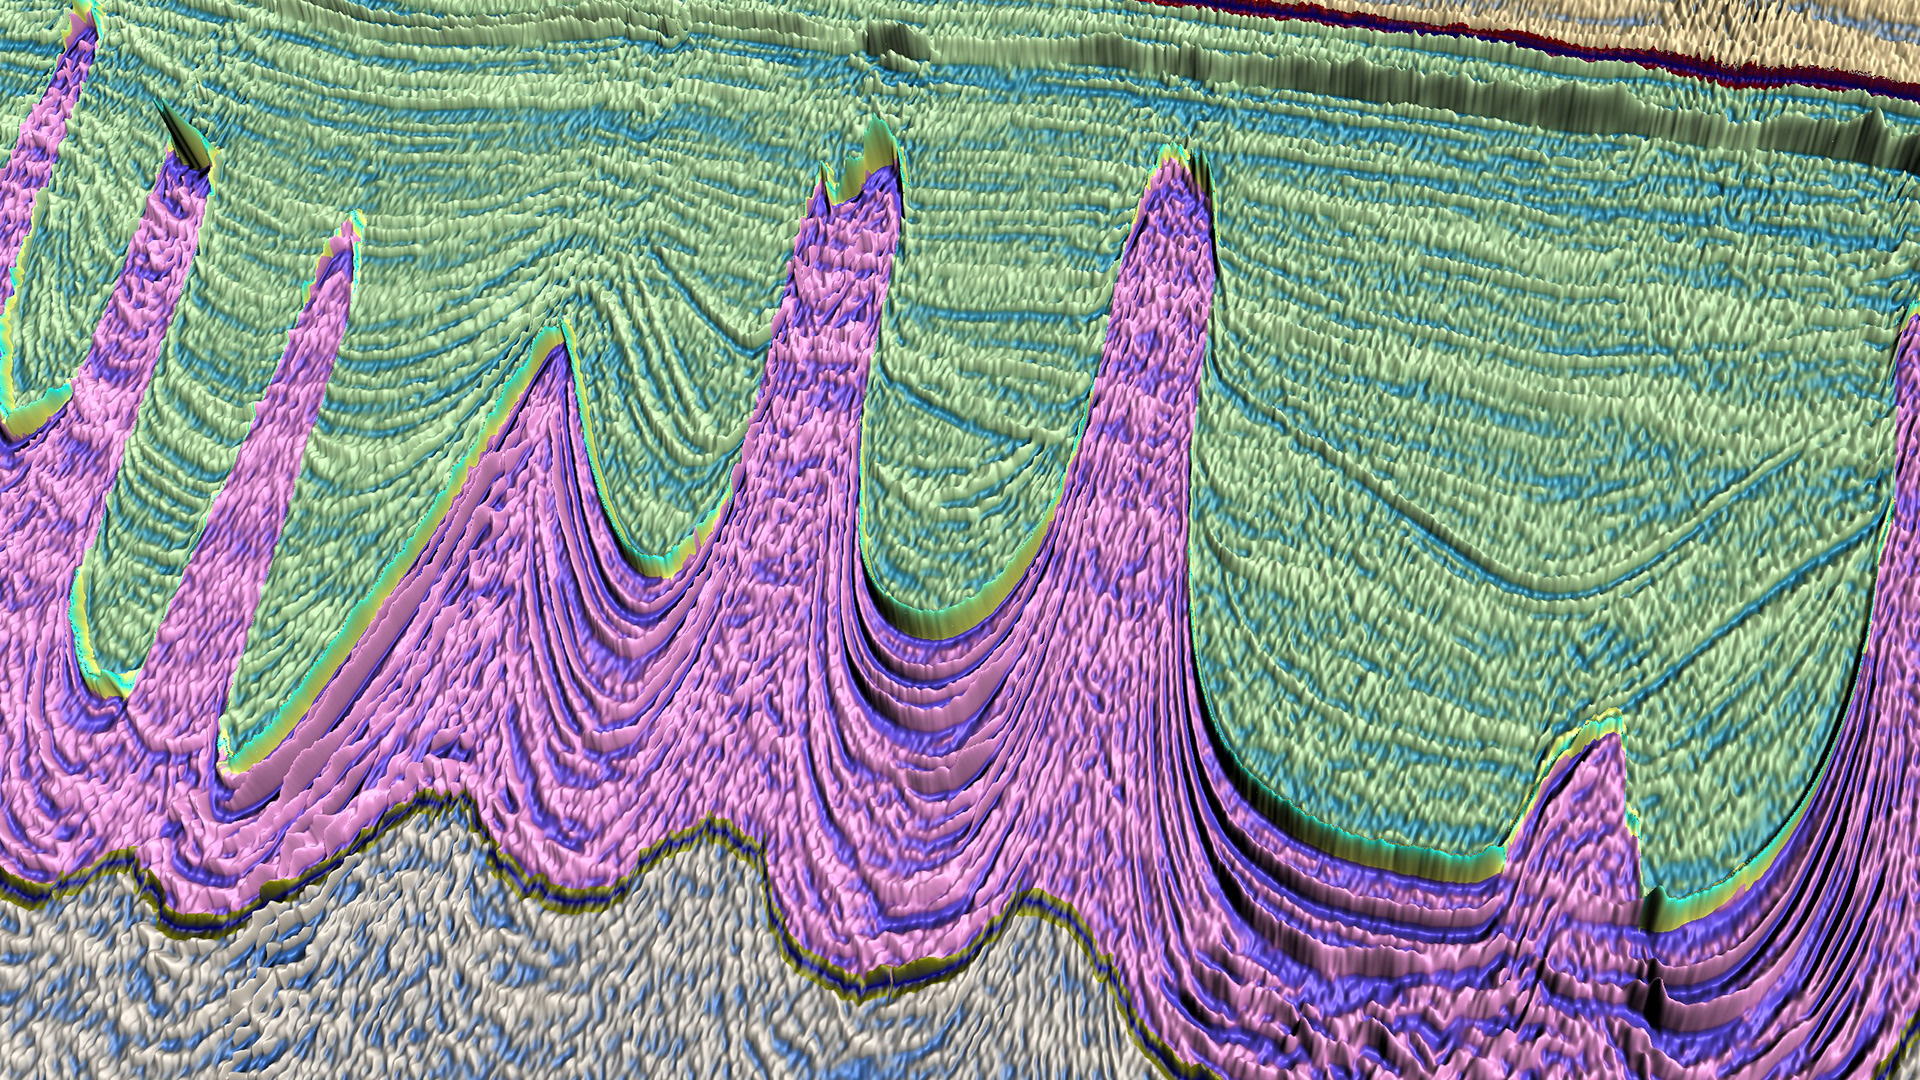
UK OGA Mid North Sea High Line 01C
VSR has come a Long Way
VSR displays are visually stunning.
But they are more than just pretty pictures.
They have a firm theoretical foundation.
And they have a very important message.
"That we have barely scratched the surface of what seismic can tell us"